Lab Report: Understand Signals From the Perspective of Frequency Domain
Author: scienceExplorationLab.comDate: 6/2/2023
Abstract
The Fourier transform is a powerful mathematical tool that can be used to analyze signals. In this lab, students will learn how to analyze signals with perspective of frequency domain. By the end of this lab, students will have a good understanding of the Fourier transform and how it can be used to analyze signals via Matlab.
The Fourier transform is a powerful mathematical tool that can be used to analyze signals. In this lab, students will learn how to analyze signals with perspective of frequency domain. By the end of this lab, students will have a good understanding of the Fourier transform and how it can be used to analyze signals via Matlab.
Background
A frequency is a measure of how often something repeats itself. In the case of signals, a frequency is a measure of how often the signal changes its value. For example, a sine wave has a frequency of 1 Hz if it goes through one complete cycle every second.
We can represent signals in the frequency domain by using a Fourier transform. The Fourier transform converts a signal from the time domain to the frequency domain. In the frequency domain, a signal is represented as a sum of sine waves of different frequencies. The amplitude of each sine wave represents the amount of that frequency present in the signal.
Materials
Equipment: function generator, scope
Software: Matlab
Step
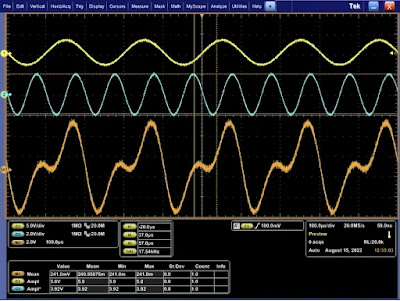
- Use function generator and scope to create a combination signal of two sine signals with frequency 5KHz, and 10KHz.
- Save waveform to a .csv file
- Use Matlab to plot the waveform in the time domain.
- Implement FFT with Matlab, and plot its spectrum
Waveform and test data
 |
| Step3: Plot waveform in time domain |
 |
| Step 4: Implement FFT with Matlab |
You can use a spectrum analyzer to directly measure the signal spectrum.
Discussion
- What do the results indicate?
- What are several advantages to using the frequency domain to analyze signals?
- Fourier transform Converts a signal into individual spectral components and thereby provides frequency information about the signal.
- A signal can be viewed in the time domain or the frequency domain, just like using a prism to decompose sunlight.
- The time domain is a representation of a signal as a function of time. The frequency domain is a representation of a signal as a function of frequency. These two representations of a signal can provide different insights into the signal's properties.
References
Fast Fourier Transformation FFT - Basics
https://www.nti-audio.com/en/support/know-how/fast-fourier-transform-fft
Tags:
Lab report EE


